Designing an end-to-end Machine Learning Workflow for Gas Well Operations
There are so many challenges that come with implementing Machine Learning solutions in large organizations, especially organizations which do not have a solid foundation of cleaned and organized data (a la data engineering), so the writing of this article has been a long time coming. A primary goal of our newly formed Data Science group within the Operations team was to design and implement an end-to-end Machine Learning workflow that could help early predict operational issues with natural gas wells, such as liquid loading challenges or hydrate buildup, and to help alert operators to these issues in a standardized and automated way.
In architecting a ML solution for near realtime Gas Well issue detection, I had to simultaneously evaluate and decide upon the supportive tools and platforms we would need in order to not only build and productionalize a model, but to also navigate all of the data engineering challenges inherent with an organization with no standardized/performant data warehouse or cloud resources.
Additionally, while I am very familiar with the higher level analysis of oil and gas assets, this project required some learnings surrounding our Operational practices - specifically so the solution would ultimately be helpful for the people most impacted by the results of these ML models. This required the embedding of those subject matter experts (SME's) within the data workflows to ensure clean & accurate data, but also to crowdsource useful labels via their input, as well as to to help them gain a better understanding of the potential of Machine Learning.
The goal
The goal of this project was to create a Machine Learning model that could predict the operational state of a gas well, based on the data that was being collected in real time. The model would be used to help operators identify when a well was not operating as expected, and to help them troubleshoot the issue. The model would also be used to help identify when a well was operating in an unexpected state, and to help operators identify the root cause of the issue. Because each well tends to have its own unique operational characteristics, the model would need to be partitioned or segmented on a per-well basis, and would need to be retrained on a regular basis to account for changes in the well's operational characteristics over time.
For a small company with over 7000 active wells, the option to monitor each well in real time manually is a difficult proposition. Machine Learning is intended to help automate this process, and to help operators focus on the wells that need attention, rather than having to monitor all wells at all times - a practice we call Operating by Exception.
The Data & Tools
The data used to train the model was collected from a variety of sources, including SCADA (Supervisory Control and Data Acquisition) systems, which collect data from sensors and devices in the field.
Ignition
Ignition is a historian program which collects data from the SCADA system and stores it in a SQL Server database. Additionally, Ignition contains flexibility surrounding user input, which allows operators to enter information about the well's operational state, and to enter information about any events that occur. This data is also stored in the SQL Server database.
Data is ingested into Ignition on 5-15 minute intervals, and for a single field of 200 wells, this amounts to roughly 1 million rows of data per day. The Ignition table structure is complicated, not designed for easy analytic use, and the assignment of SCADA tags to official bottomhole UWI's (Unique Well Identifiers as assigned by the Regulator) is not complete or consistent , requiring tag_id's to be explicitly mapped to UWI.
NocoDB for Tag Mapping
NocoDB is an open source 'Database as a Spreadsheet' tool that allows users to edit a PostgreSQL database from a spreadsheet-like interface. It was set up to maintain an official list of UWIs, store general information about the wells, including the UWI, the well name, the well status, hierarchy information, and all of the validated tag_id's for each well. This is a manual process that was tasked to the IROC (Integrated Remote Operations Center) team, who are responsible for maintaining the Ignition system. Eventually, this will be transitioned to a Streamlit app with direct manipulation of a Snowflake table via forms.
Tableau Prep
Tableau Prep is a data preparation tool that allows users to connect to a variety of data sources, including SQL Server, and to perform data cleaning and transformation operations on the data. For this project it was used only to incrementally injest new data from the Ignition SQL Server into Snowflake every 30 minutes. In my experience, Tableau Prep is useful for small data sets, but is not performant enough to handle large data sets, and is not flexible enough to handle complex data transformations - such as those needed for this project - enter Snowflake and Snowpark.
Snowflake and Snowpark
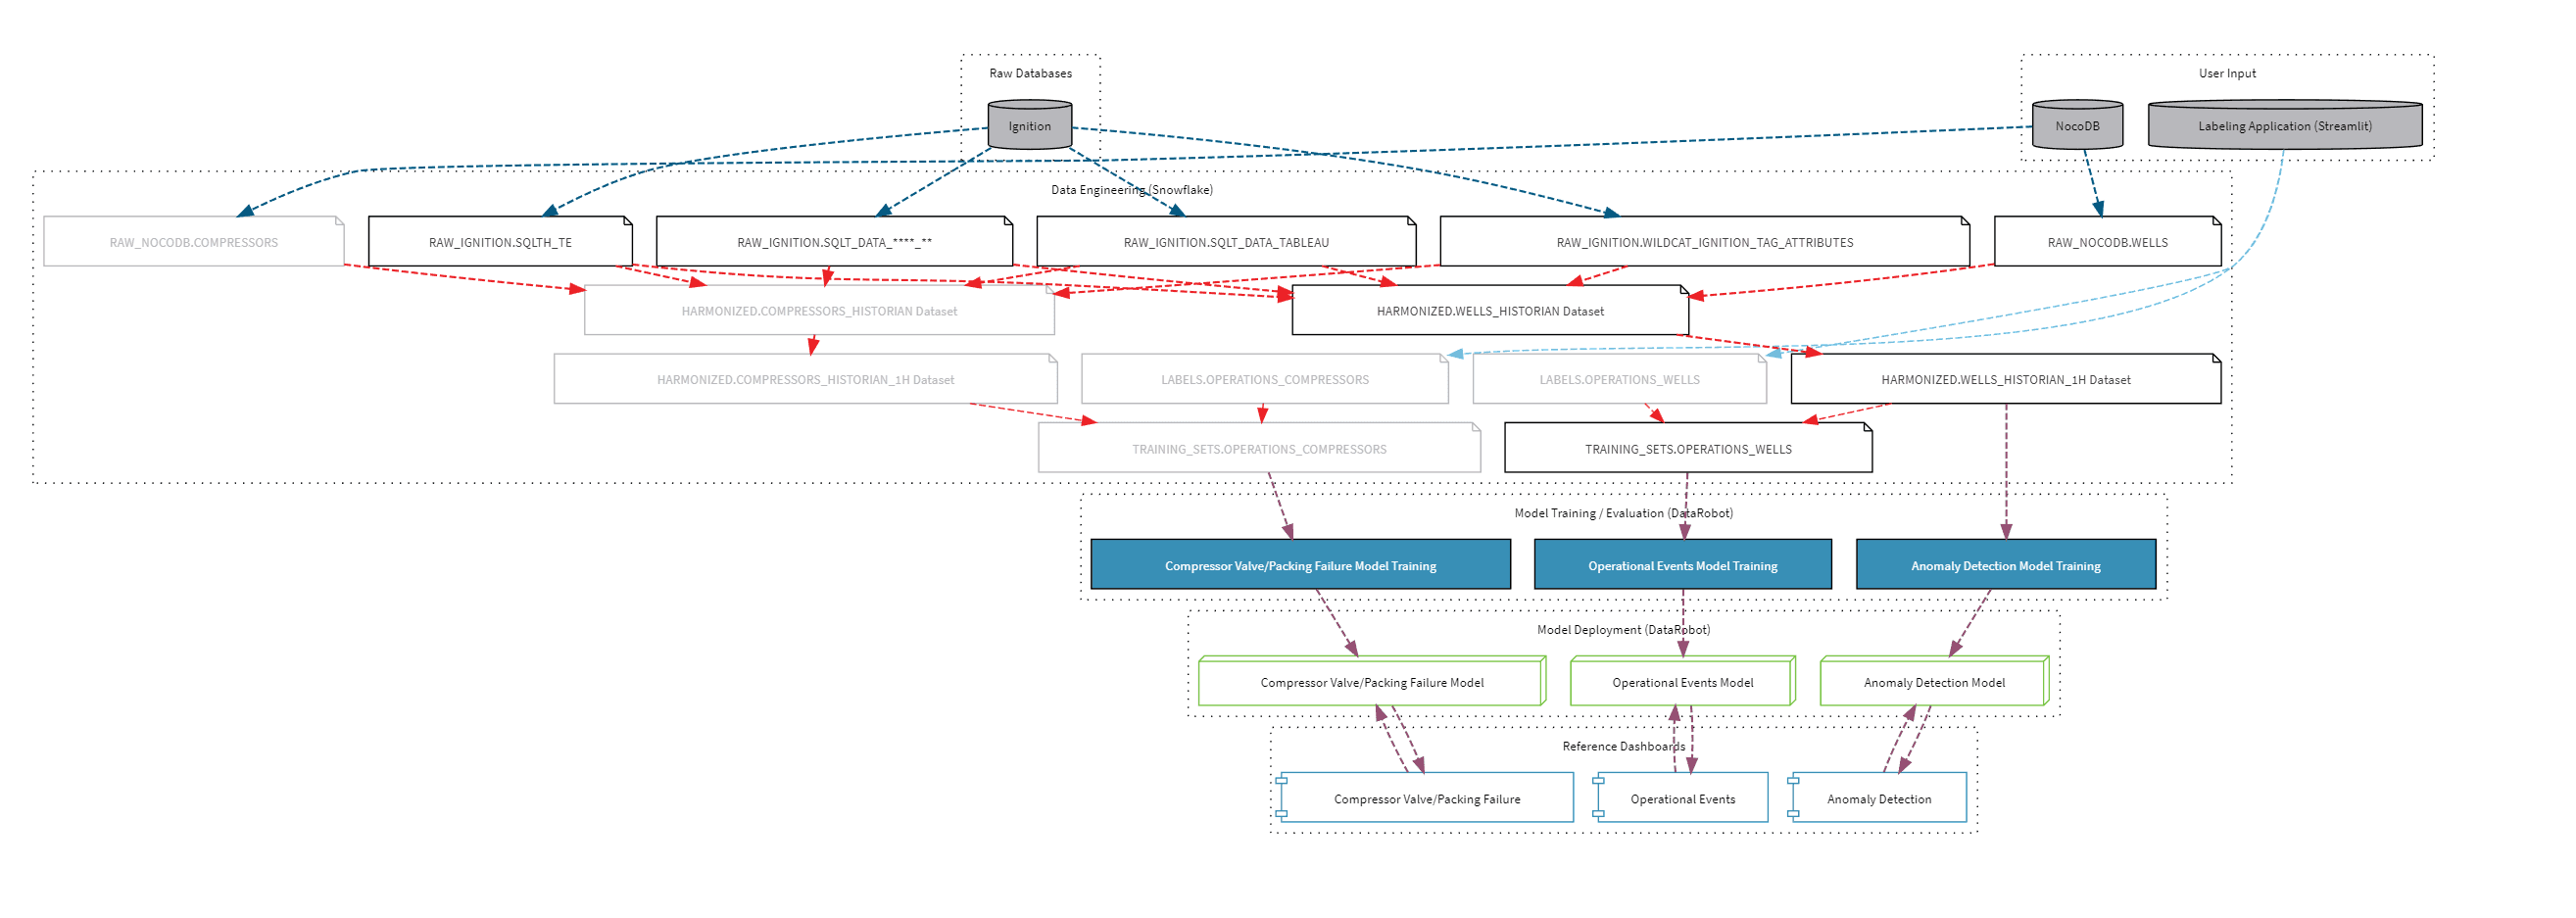
Snowflake is a cloud-based data warehouse and compute engine that allows users to store and query large amounts of data. It is also capable of running user-defined functions (UDFs) written in a variety of languages, including Python, Java, and Scala. For this project, Snowflake was used to store the data from Ignition and NocoDB, and to run the Python and SQL scripts that were used to clean and transform the data.
Without going into too much detail, all Data Engineering workflows developed utilize some of Snowflake's most useful features, including:
- Streams - which allow for the incremental ingestion of data from a source table into a target table
- Tasks - which allow for the scheduling of SQL and Python scripts to run on a regular basis
- Stored Procedures - which allow for the creation of reusable SQL scripts that can be called from other SQL scripts
- User Defined Functions - which allow for the creation of reusable Python scripts that can be called from SQL scripts
- Snowpark - which allows for the creation of reusable Python scripts that can be called from SQL scripts
- A cleaned Historian dataset is created by joining the Ignition data with only the tags as added to the NocoDB data. It incrementally updates itself each hour.
- This dataset is then resampled to hourly intervals and cleaned more aggressively, dealing with NaN's and outliers.
These python scripts are executed as stored procedures and executed as tasks on a regular basis on the hour and only if new data is available.
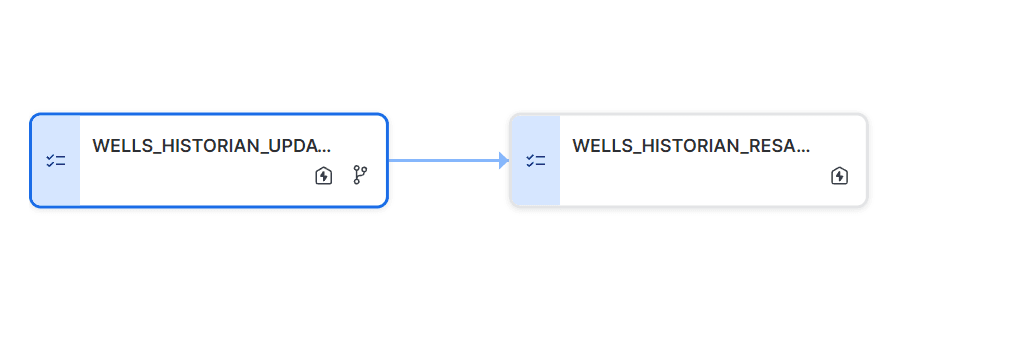
The two historian tasks as linked in Snowflake.
Streamlit and Trainset for User Labeling
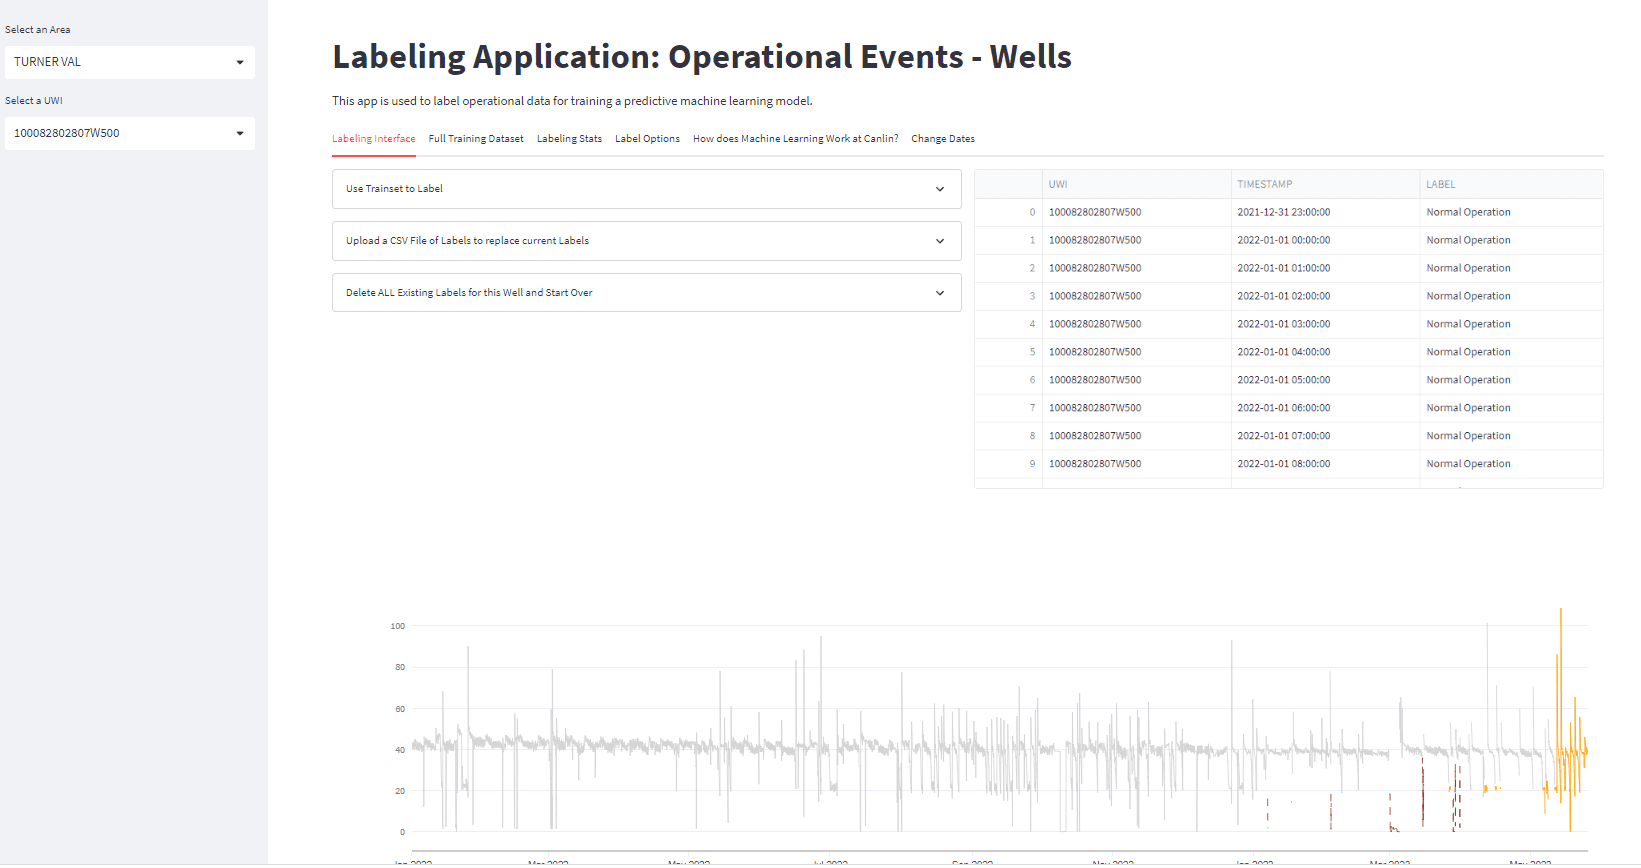
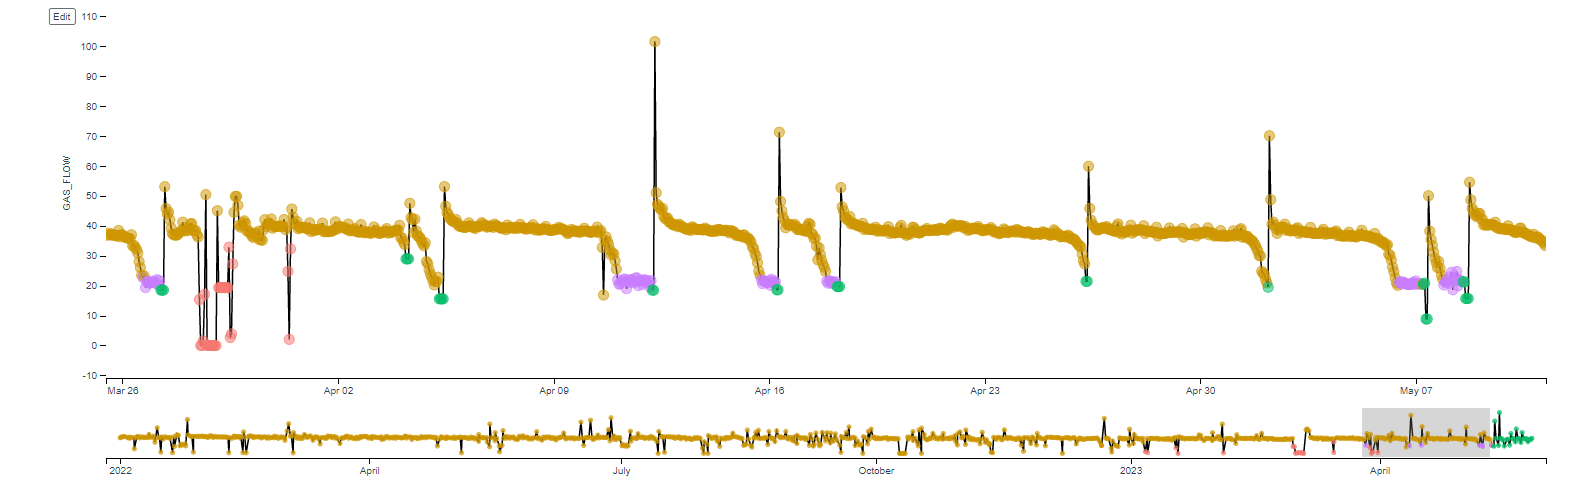
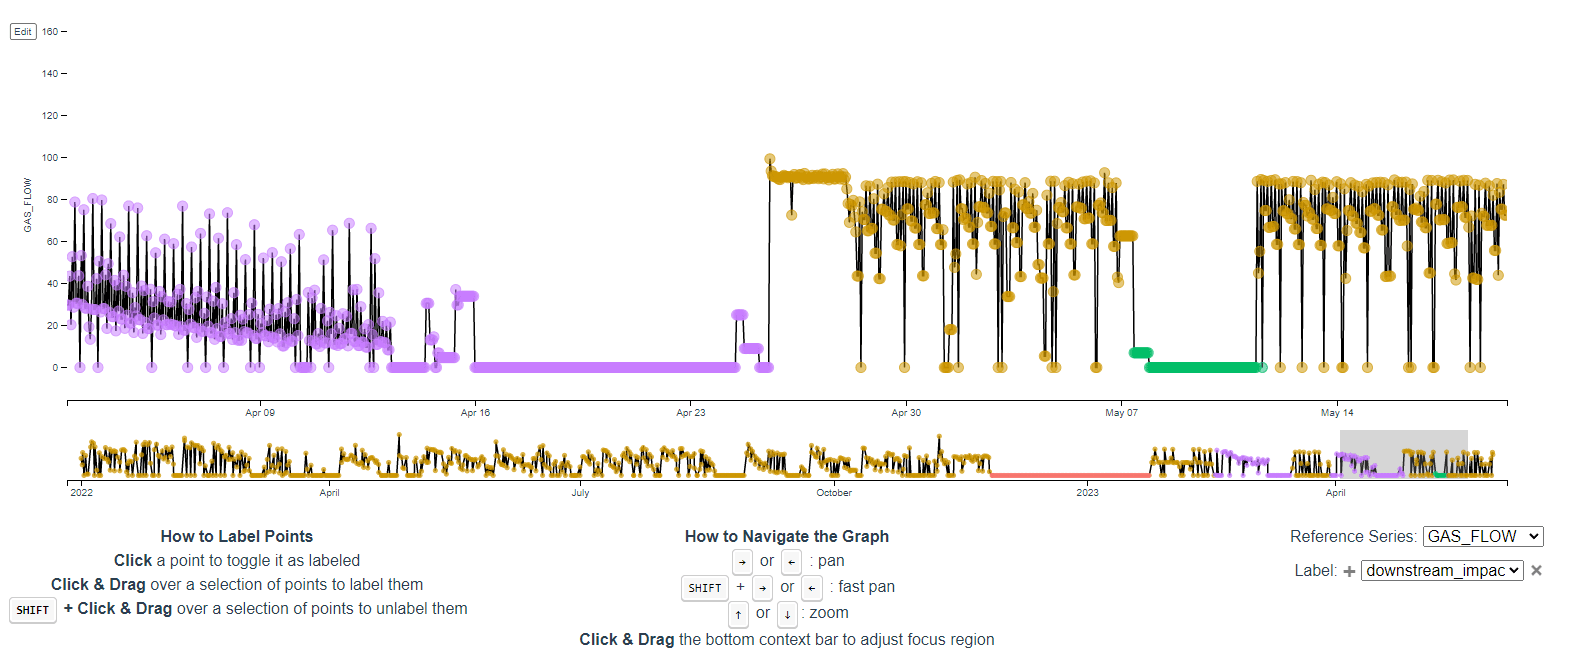
A Streamlit App was developed to be the primary interface for IROC operators to label the relevant time series data on a per UWI basis. The app allows users to select a single well, passing data back and forth to a lightweight open source timeseries labeling tool called Trainset, and then submitting the newly updated labels to Snowflake directly. Some comparison charts are also provided for a quick view of the current labels.
## Example Labels (with groups)
## This is a first pass of useful operational events that can be used to
## train a model for gas wells. It will be expanded upon as additional
## common events are identified.
[
  {
    "Normal Operation": [
      "Normal Operation"
    ]
  },
  {
    "Hydrate": [
      "PRE- Hydrate Forming",
      "DT- Downhole Hydrate",
      "DT- Pipeline Hydrate",
      "DT- Facility Hydrate"
    ]
  },
  {
    "Liquid Loading": [
      "PRE- Well Loading Up",
      "DT- Well Loaded",
      "DT- Shut-in for Buildup"
    ]
  },
  {
    "Downhole Issues": [
      "PRE- Wax or Scale Buildup",
      "DT- Wax or Scale",
      "PRE- Mechanical Wear",
      "DT- Mechanical Failure"
    ]
  },
  {
    "Artificial Lift": [
      "Pump Failure"
    ]
  },
  {
    "Downstream": [
      "Downstream Impact"
    ]
  },
  {
    "Unpredictable": [
      "Power Outage",
      "Coms Outage",
      "ESD Closure"
    ]
  }
]
Training Dataset
Ultimately, after the data flows through the data engineering workflows as alluded to in the graphic above, the training data set is produced in Snowflake as a join of the resampled historian data and the user labeled data. Great care is taken to ensure that each well is fully populated for every hour timestamp since January 2022 (nan's handled differently depending on the feature), and that the labels are properly filled in for each well.
CREATE OR REPLACE VIEW TRAINING_SETS.OPERATIONS_WELLS AS
SELECT * EXCLUDE (label_count, normal_op_count) FROM (
    select
        t.UWI,
        t.TIMESTAMP,
        t.TEAM,
        t.major_area,
        t.area,
        t.gas_flow,
        t.gas_press,
        t.gas_temp,
        t.gas_dp,
        t.plunger,
        t.choke_position,
        t.esdv_open,
        t.esdv_closed,
        t.status,
        t.eto_date,
        t.notes,
        t.availability,
        coalesce(t.label, lag(t.label) IGNORE NULLS over (partition by t.uwi order by t.timestamp)) as label,
        count_if(t.label IS NOT NULL) over (partition by t.uwi) as label_count,
        count_if(t.label = 'Normal Operation') over (partition by t.uwi) as normal_op_count
    FROM (
        SELECT
            h.*,
            l.label
        FROM HARMONIZED.WELLS_HISTORIAN_1H h
        LEFT OUTER JOIN LABELS.OPERATIONS_WELL l
        USING (UWI, TIMESTAMP)
        ORDER BY 1,2
    ) t
    WHERE TIMESTAMP   <= dateadd('day', -1, current_date())
)
-- include only wells with at least one label, and the well isn't labeled as only 'normal operation' (for now)
WHERE label_count != 0 and label_count != normal_op_count
;
DataRobot
As a very small Data Science team (1 person), DataRobot was advocated as a way to quickly get a models up and running within our organization. DataRobot is a SaaS product that allows users to upload data, select a target variable, and then automatically train and tune a variety of different machine learning models. It also provides a variety of tools to help users understand the model, including feature importance, partial dependence plots, and a variety of other tools. In general, it shortens the time to value for a data science project by allowing our team to quickly iterate on different models and parameters, and then deploy the model to production without involving our IT group.
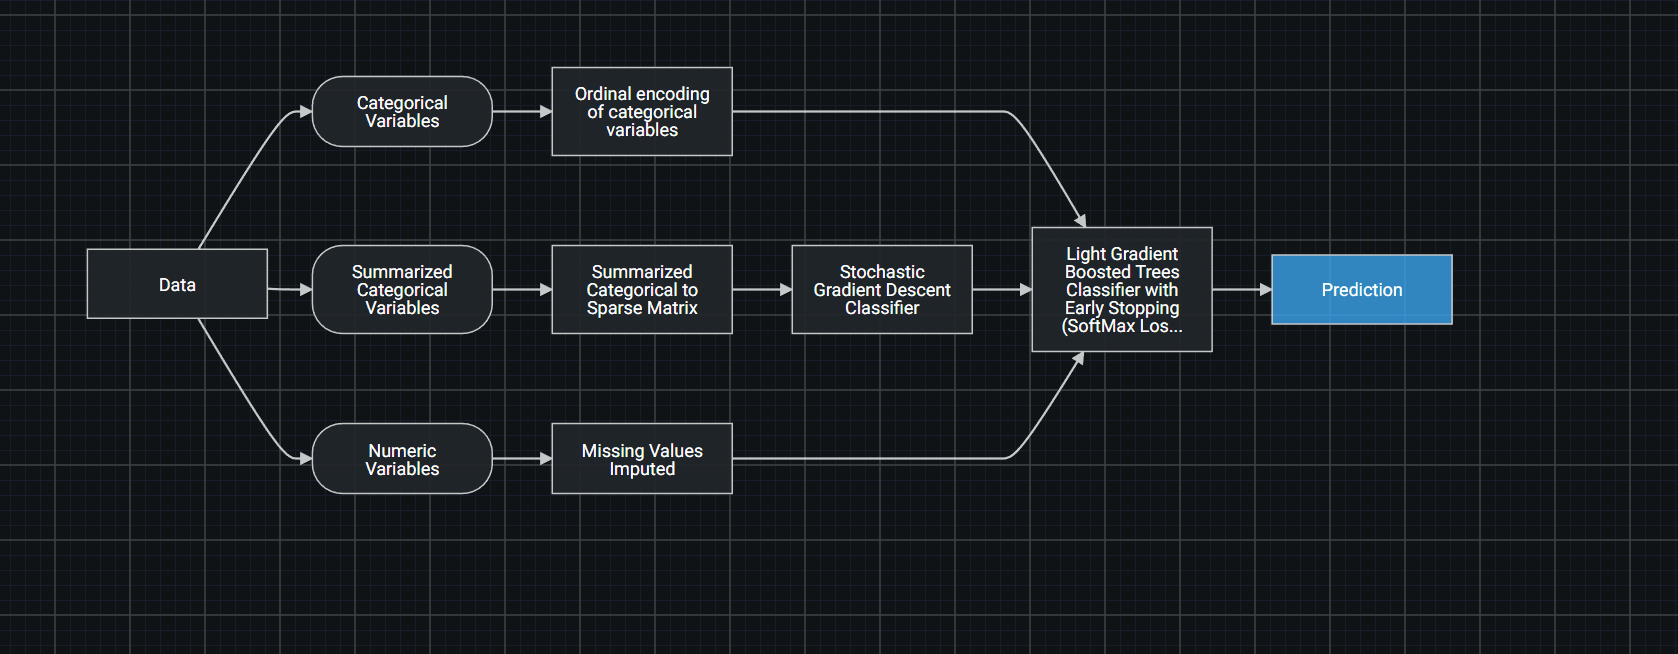
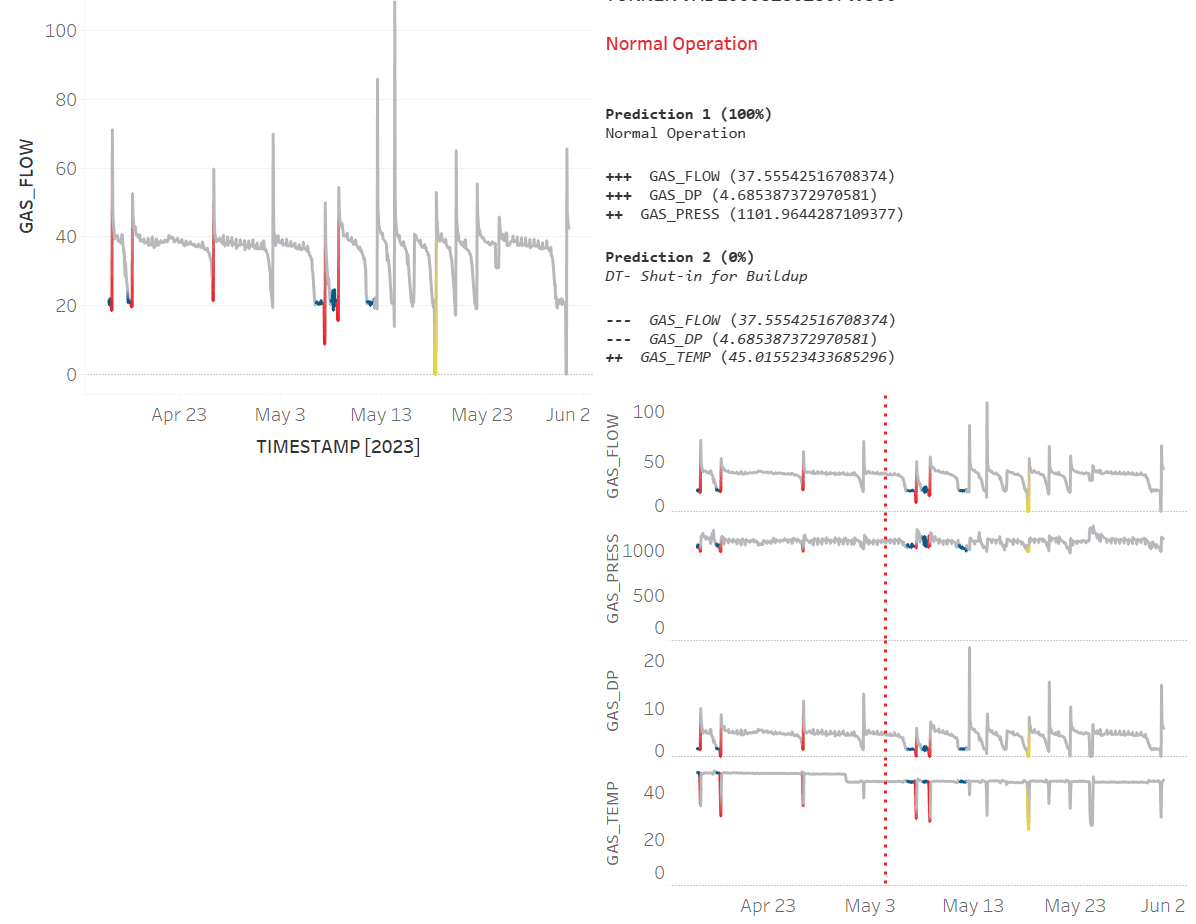
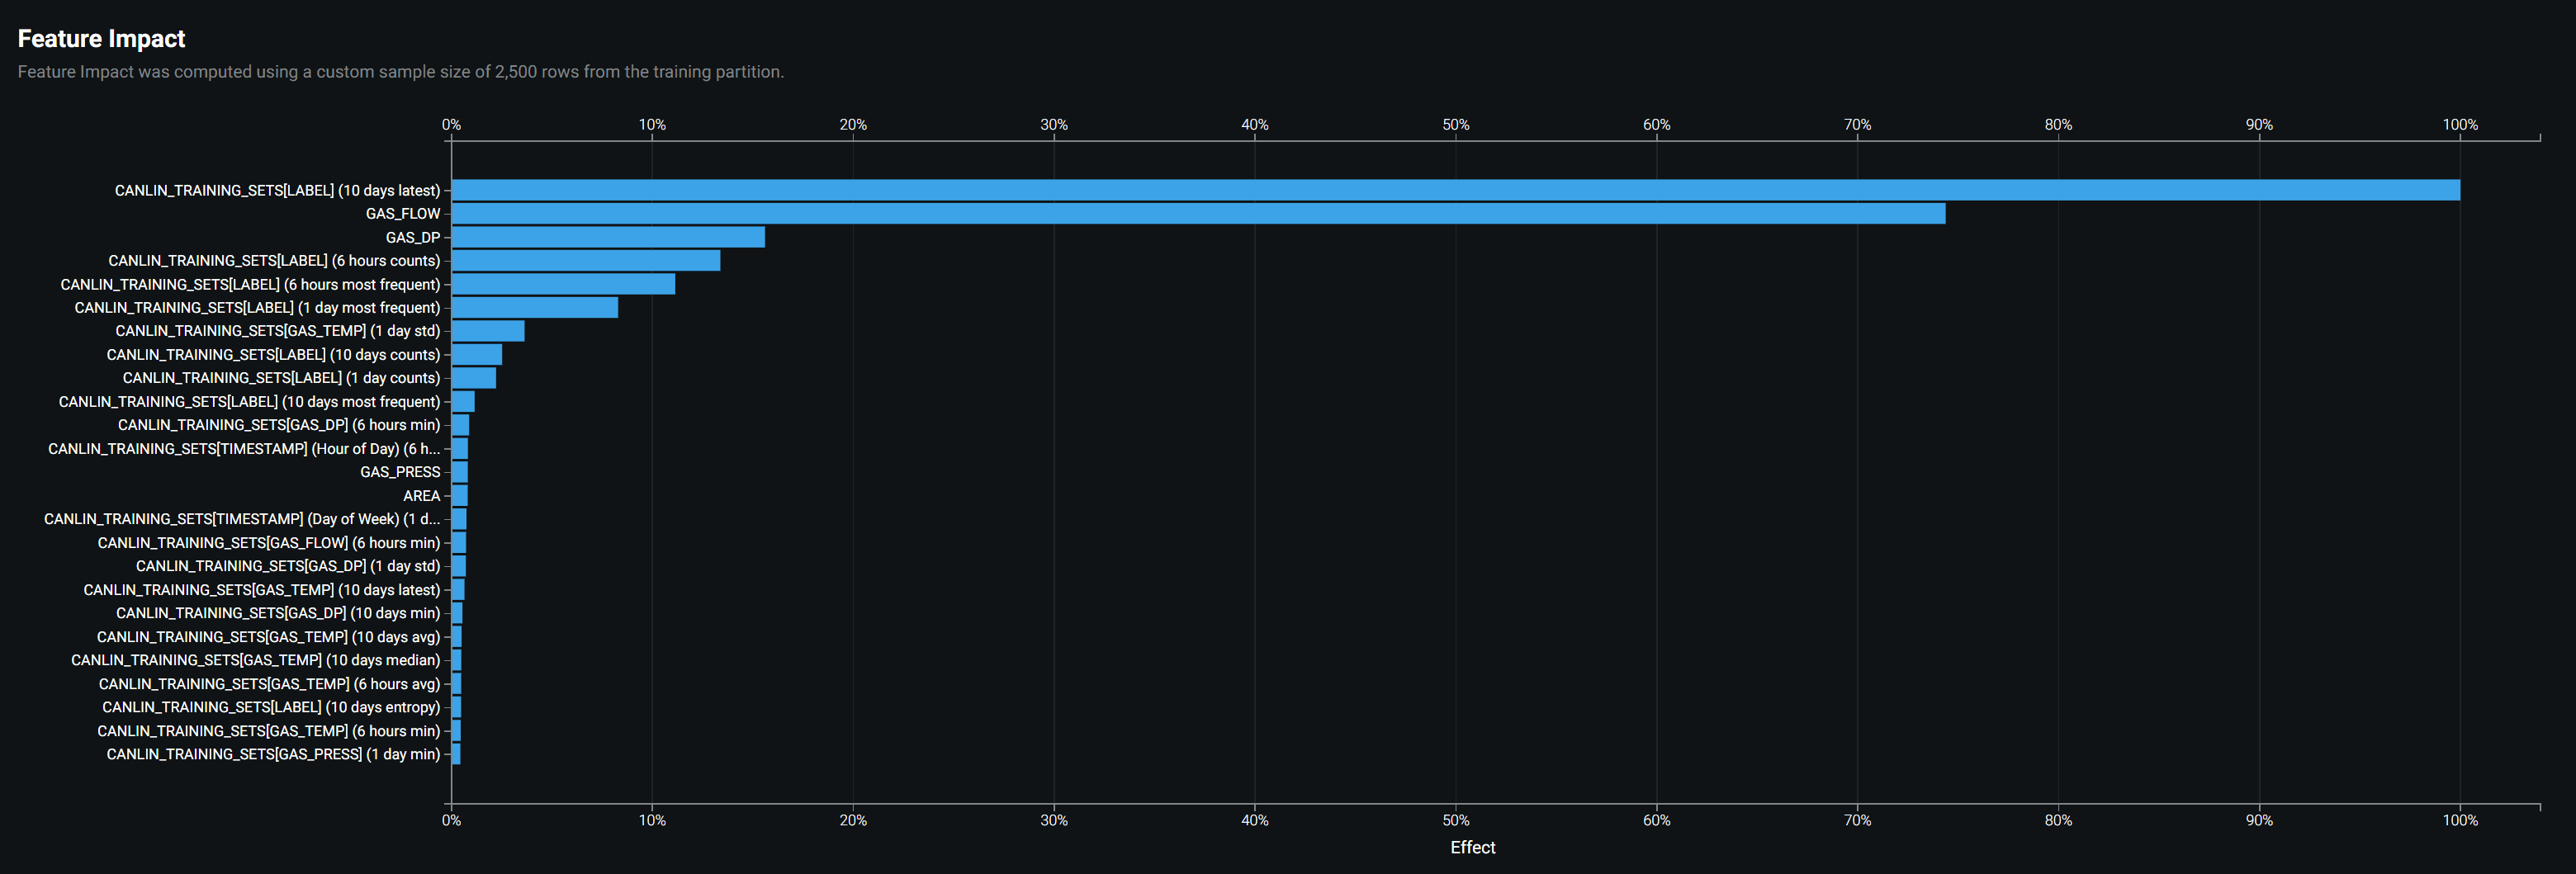
Another advanced feature of DataRobot that was leveraged was the ability to generate a multitude of timeseries lag features for each timestamp - allowing the model to learn from the past via rate of change, rolling averages, and other features. While python packages such as tsfresh could provide this functionality, having it embedded within DataRobot allows for quick iteration on models and different raw feature sets. The following chart shows the most important features for the model, with the most important feature being the most recent label for each well (notionally this makes sense), followed closely by the raw Gas Flow rate and Differential Pressure, both primary indicators for instantaneous changes at the wellhead.
Early Results
The model generated in the previous step was set up in a production deployment in DataRobot, where a recurring Job Definition was also set up to injest new data from our resampled Historian Dataset every 6 hours - outputting the inferred predictions back into a PREDICTIONS.WELL_OPERATIONS table in Snowflake.
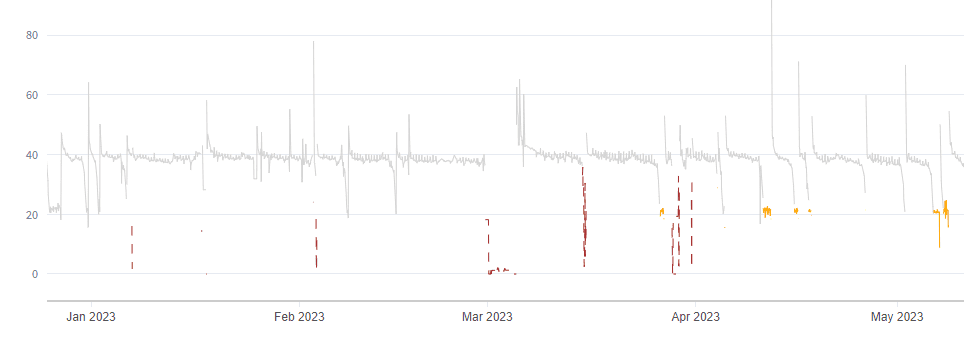
This PREDICTIONS.WELL_OPERATIONS table was then visualized in Tableau to showcase the categorical labels for each well, as well as the current predicted label counts for all wells within our operations.