
Implementing Tableau as the Primary Data Platform for a Mid Sized Oil and Gas Company
While transitioning into a Reserves role at a previous company, I proposed and implemented a new data visualization platform and data warehouse for the company - primarily (and selfishly) in order to standardize and reduce repetition in my current role. Besides my personal goals, the overarching corporate goal was to create a single source of truth for all data, and to provide a collaborative environment for all employees to access and analyze data. The new platform was implemented using Tableau Prep, Tableau Desktop, and Tableau Server.
Why Tableau
Tableau is a data visualization tool that is used to create interactive dashboards and reports. Besides its visualization capabilities, which are the hallmark of the product, it is also able to connect to a variety of data sources, including most types of databases. Because the oil and gas industry is notorious for having tens if not hundreds of different software to manage the data related to nuanced aspects of the business, ultimate data flexibility was key.
Tableau also has a built in ETL tool called Tableau Prep, which allows users to clean and transform data before it is visualized. Tableau Prep is a newer product provided by Tableau, but it is designed to be very easy to use - and leverages a fairly simple GUI (graphical user interface) to abstract away SQL code so that users unfamiliar with SQL can still interact with the 'source' databases.
Lastly, Tableau has a product called Tableau Server, which is a data warehouse that allows users to store data in a central location, and then access it from anywhere. Tableau Server also allows users to share dashboards and reports with other users, and to collaborate on data visualizations. This was a key feature for a company like ours, which had wildly complex data sources and structures, and where standardization and a single 'source of truth' are key to success.
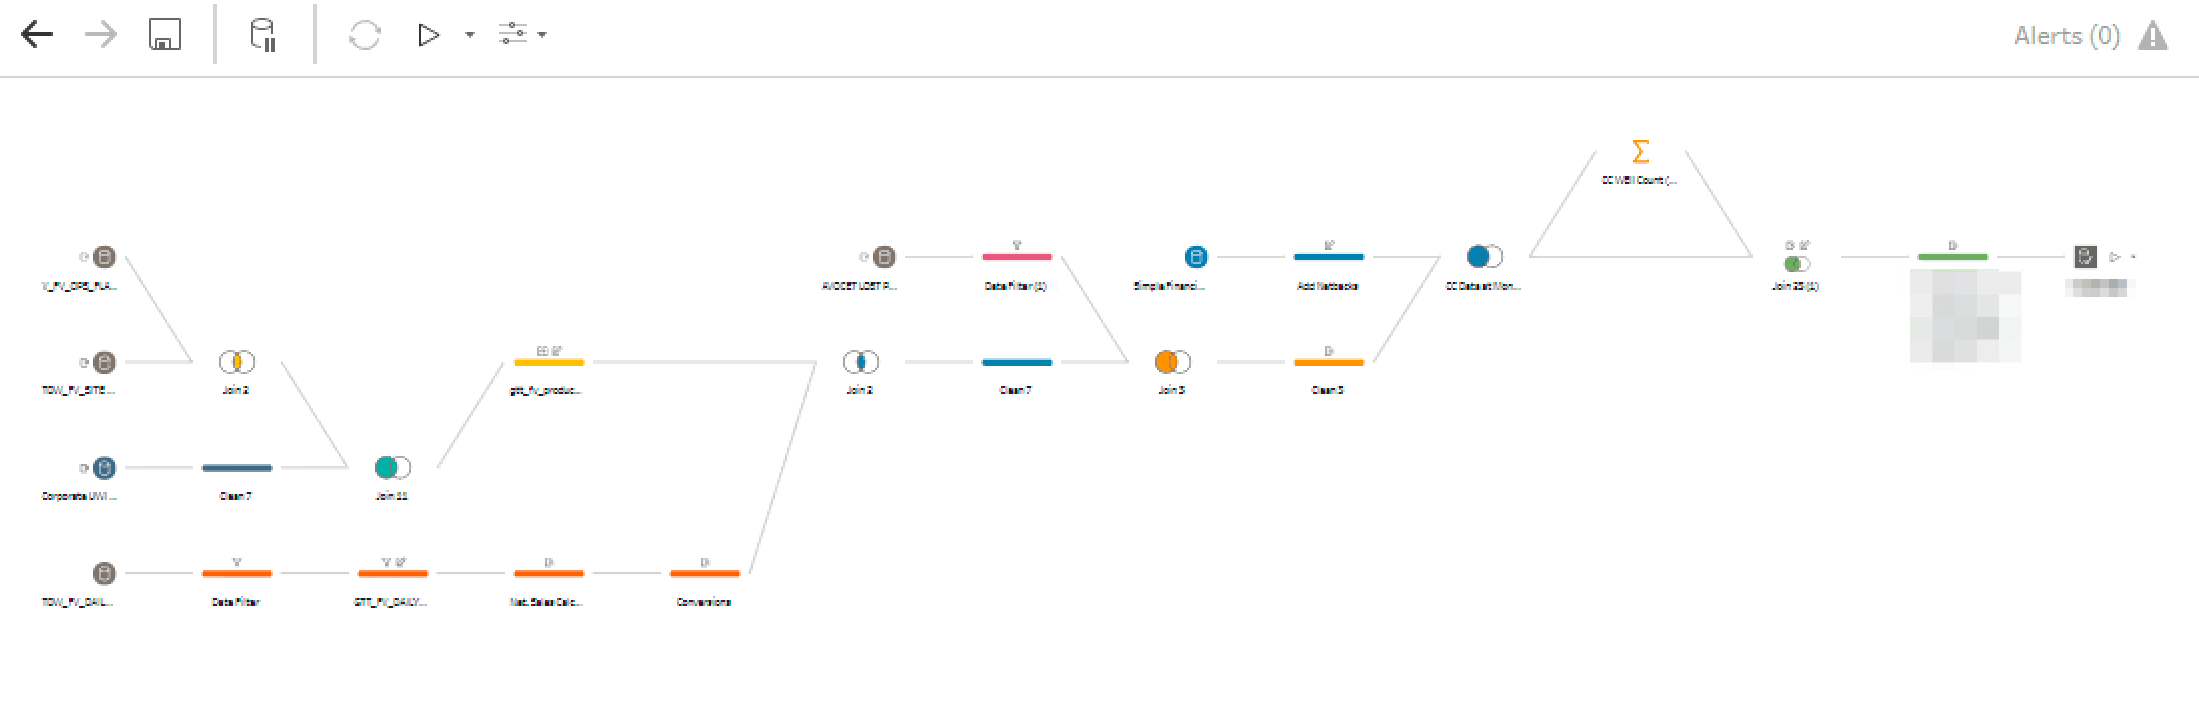
An example Tableau Prep Flow (ETL) which produces one 'cleaned' dataset from a handful of raw database tables
Implementation
One of the main considerations behind choosing Tableau for data warehousing and data cleanup was the fact that it is a relatively easy tool to learn and did not require much prior knowledge about relational databases or SQL. This was important because the company had a very small IT department, and the majority of the employees were not familiar with SQL - nor did they have the time or mandate from management to learn it. Tableau Prep is designed to be a tool that can be used by anyone, regardless of their technical background.
The Tableau Server utilizes per-user licensing, with three different levels.
- Tableau Viewer: Individuals who can view dashboards and reports in Tableau Server, but cannot create new ones.
- Tableau Explorer: Individuals who can create new dashboards in Tableau Server using existing datasets, but cannot create new datasets or reports.
- Tableau Creator: Individuals who can create new datasets utilizing Tableau Prep, and also create new dashboards and reports in Tableau Desktop.
The few individuals with some experience with relational databases were offered the opportunity to become Tableau Creators, and were given the mandate to create new datasets and reports as needed. The rest of the employees were given Tableau Viewer licenses, and were given the mandate to use the existing dashboards and reports to analyze data. This was a key part of the implementation, as it allowed the company to standardize on a single data visualization platform, and to reduce the amount of time spent on data cleanup and data visualization.
Personal Contributions
Being the primary driver of the project, I was - by default - responsible for the majority of the work that went into the implementation. This included:
- Creating the structure to maintain development of data sources, ETL flows, and dashboards. This included creating a shared drive on the company's network for Tableau Desktop and Tableau Prep files.
- Choosing and validating potential users for Explorer and Creator licenses.
- Training Explorers on how to interact with existing datasets and create new dashboards.
- Training Creators on how to create new datasets, best practices for publishing, data validation and quality control, and how to create new dashboards.
- Building out the initial data sources, ETL flows, and dashboards to showcase the capabilities of the new platform. These included:
- A primary financial information dataset pulled from the Qbyte accounting software, which was the primary source of financial operating information for the company and exceeded 8 million rows of data.
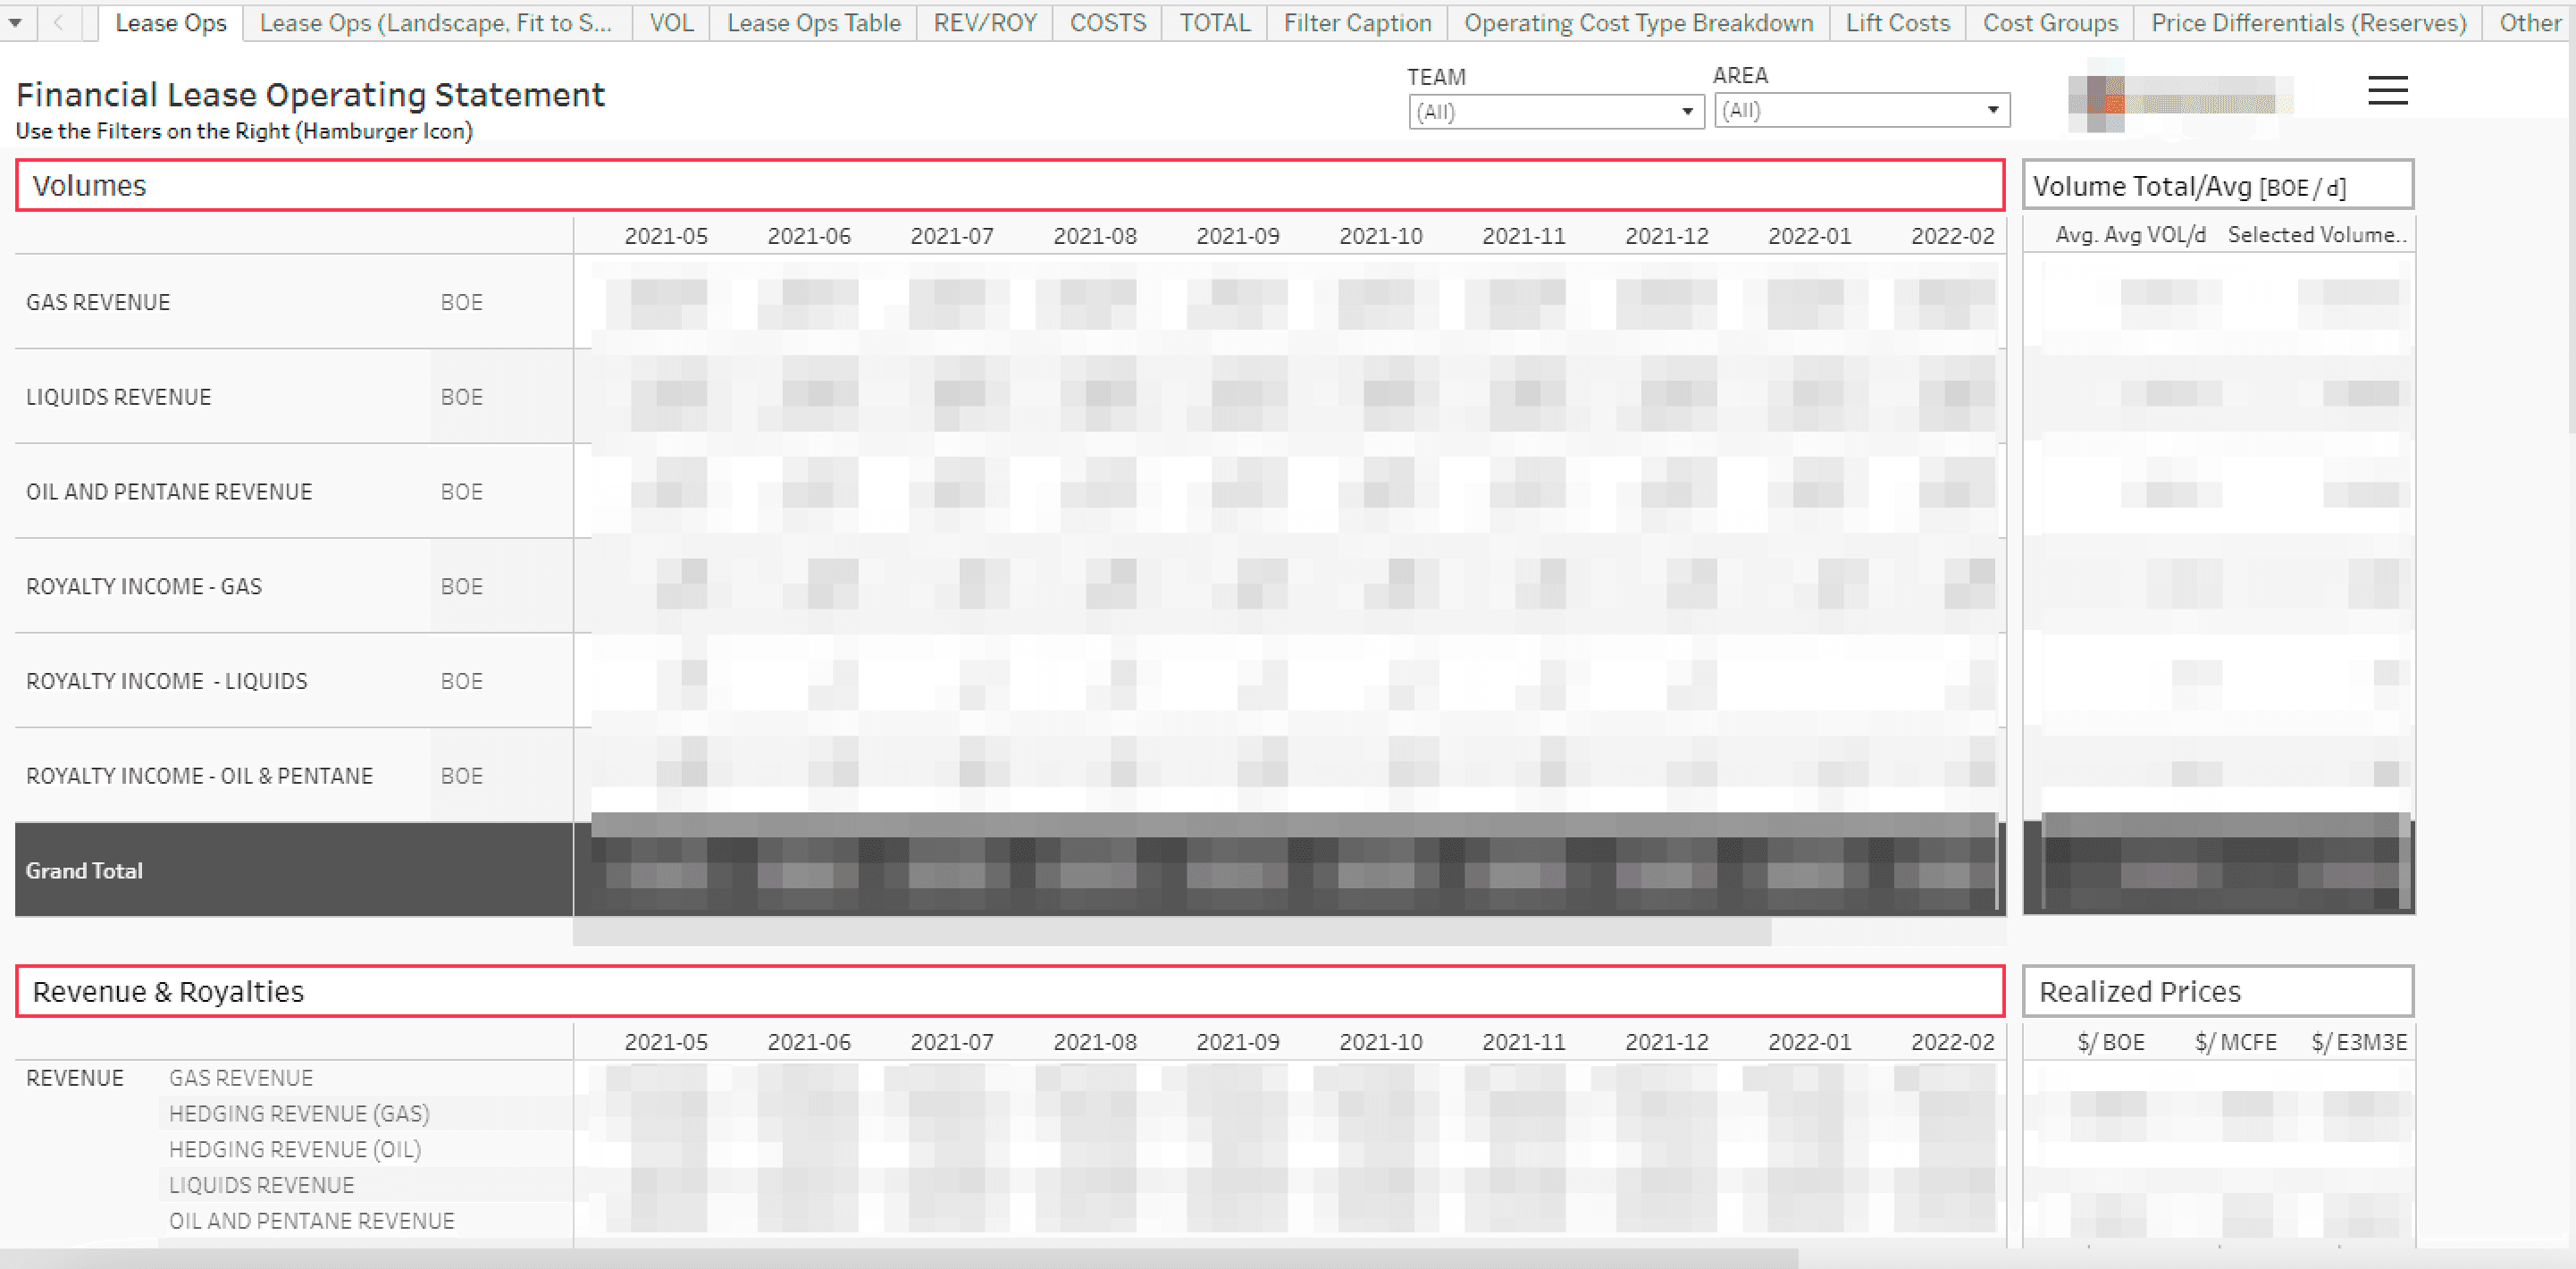
- A Lease Operating Statement Dashboard which was a mirror image of the currently maintained existing Excel spreadsheet.
- A corporate well reference dataset - a combination of 7 of our primary databases which do not maintain a common ledger of well id's.
- A corporate well reference dashboard which allows users to slice and dice the list of 13,000+ well id's by any number of parameters. This was a key dashboard, as it allowed users to quickly find well id's based on a number of important parameter filters.
- A standardized Field Data Capture dataset, which includes the daily production for every well in the company from our production accounting system. This dataset included all hydrocarbon products in multiple units of measure, and totalled over 30 million rows of data.
- A weekly production report dashboard which combined 4 sources of data, including the standardized Field Data Capture dataset, Financial production data, manually entered field predictions, and budget information, to create a standardized weekly production report including each of our producing wells.
- Maintenance of all corporate level reports and dashboards, including the corporate production report, corporate financial report, and corporate well reference report.
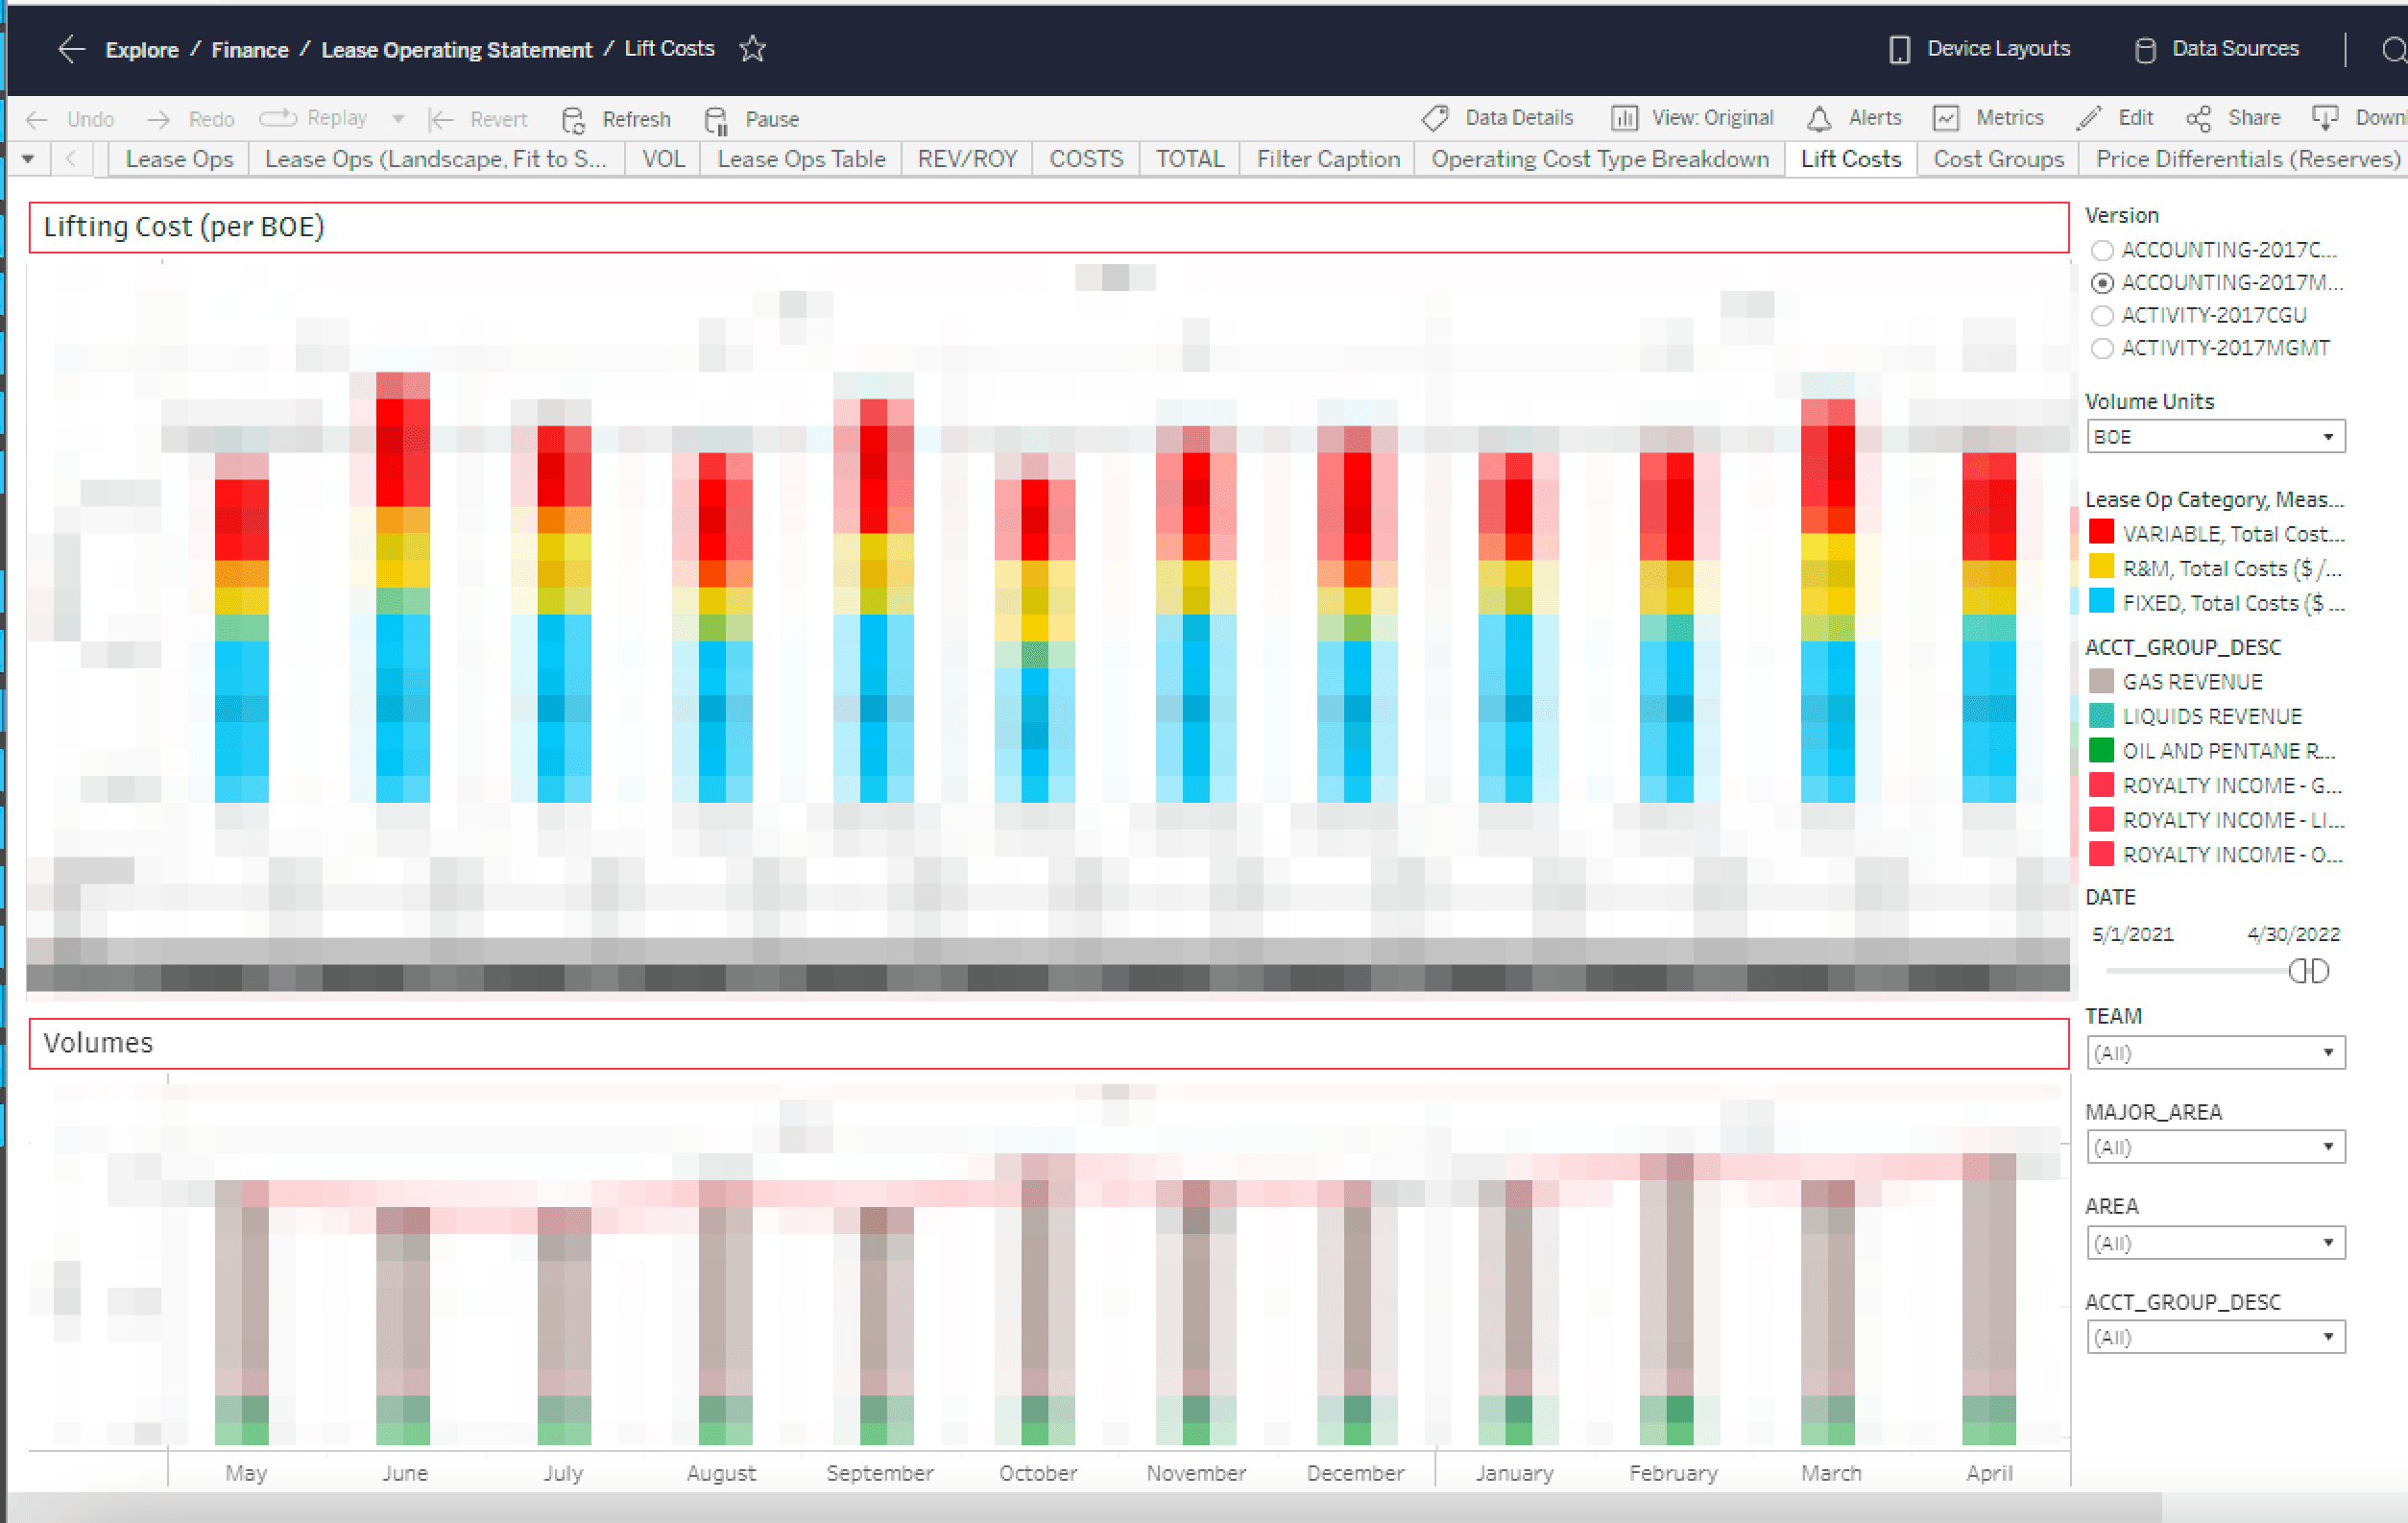
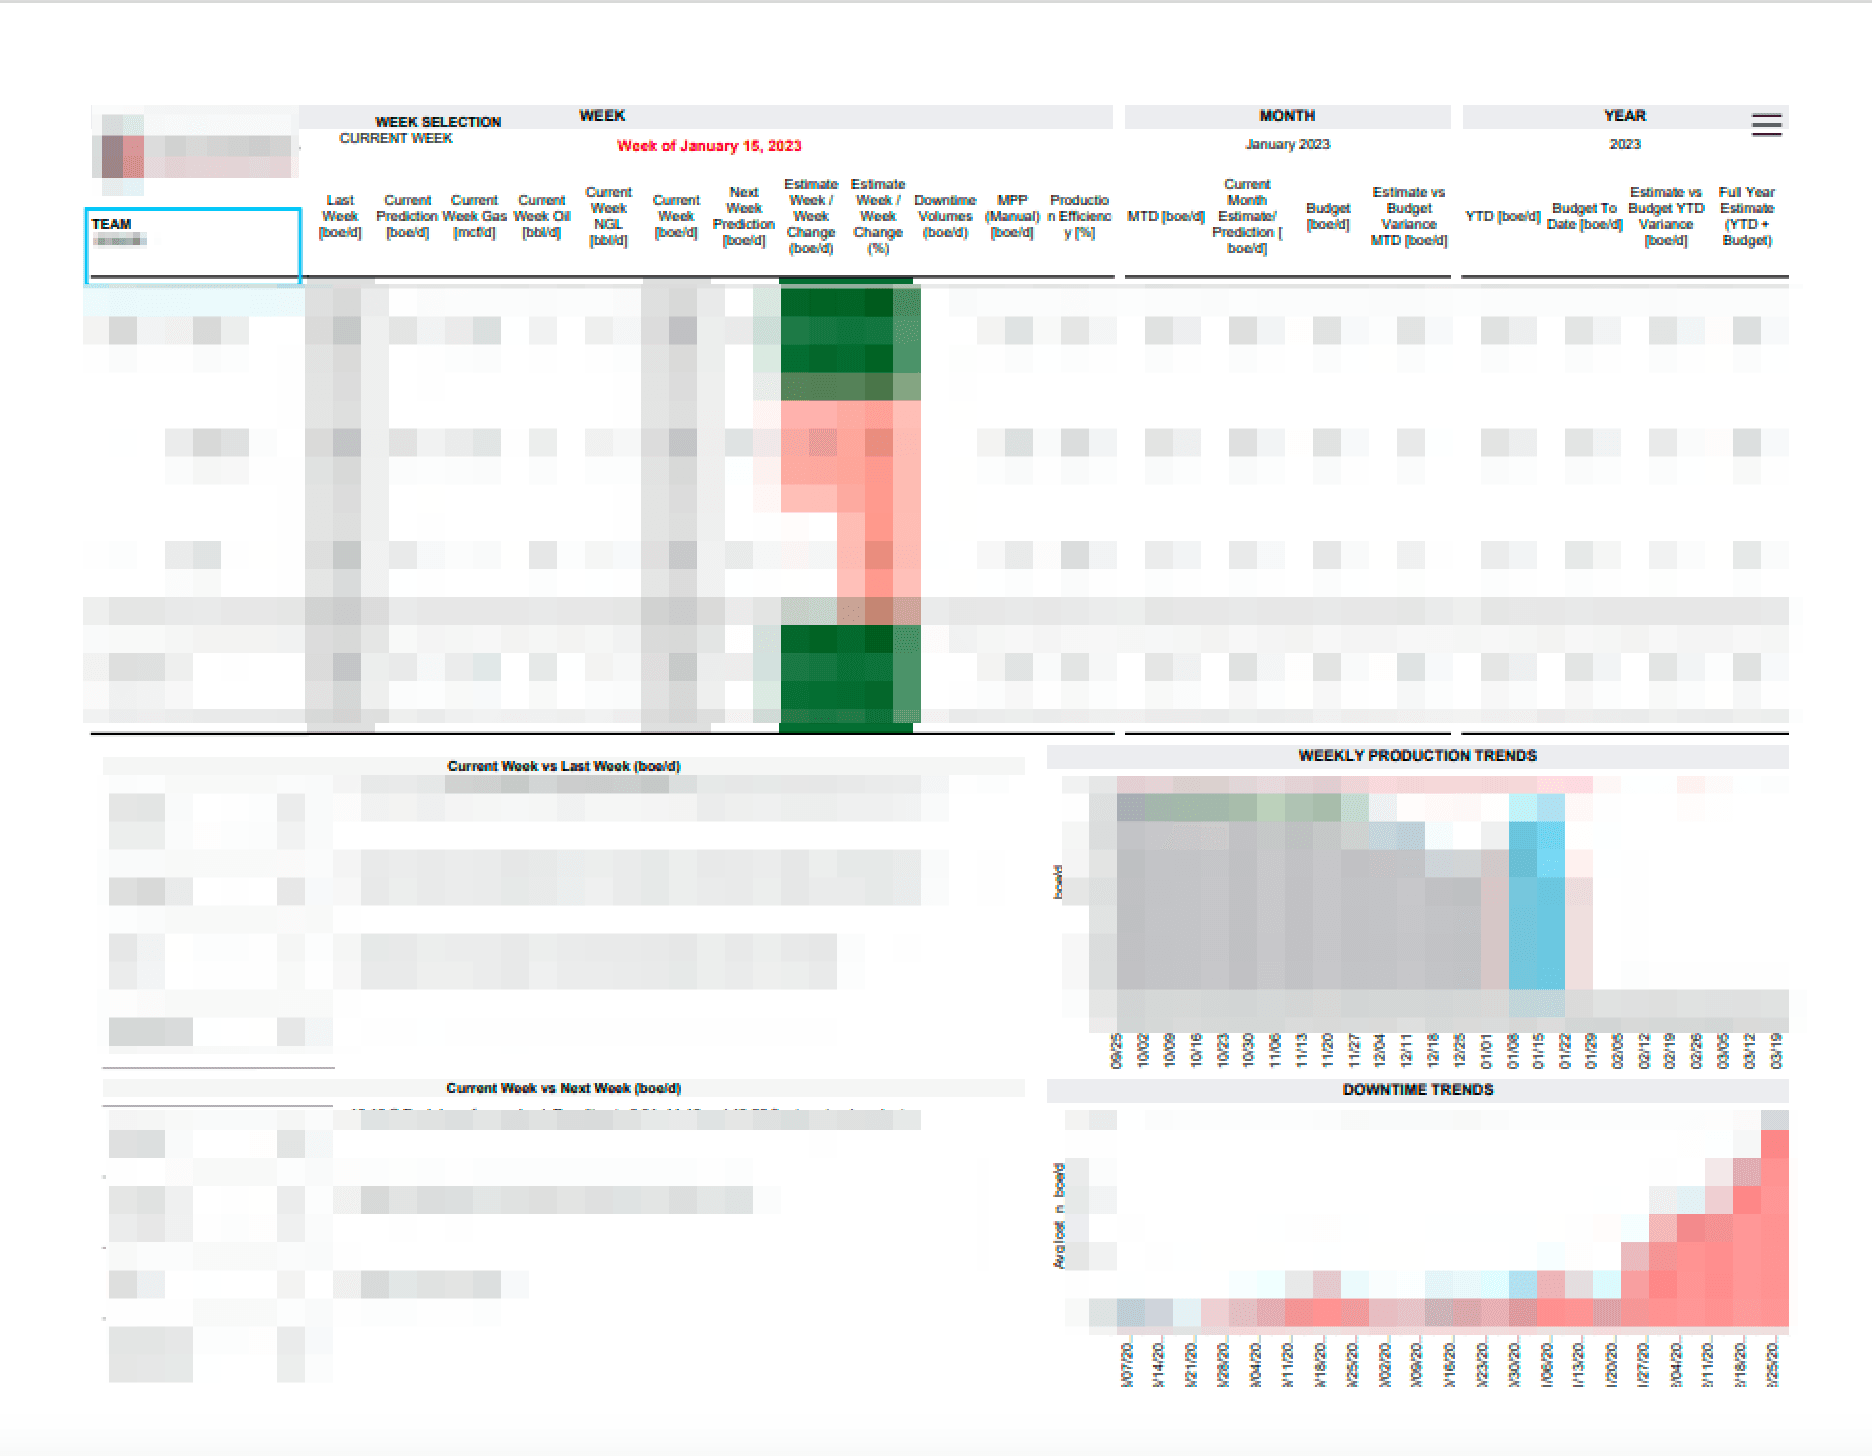
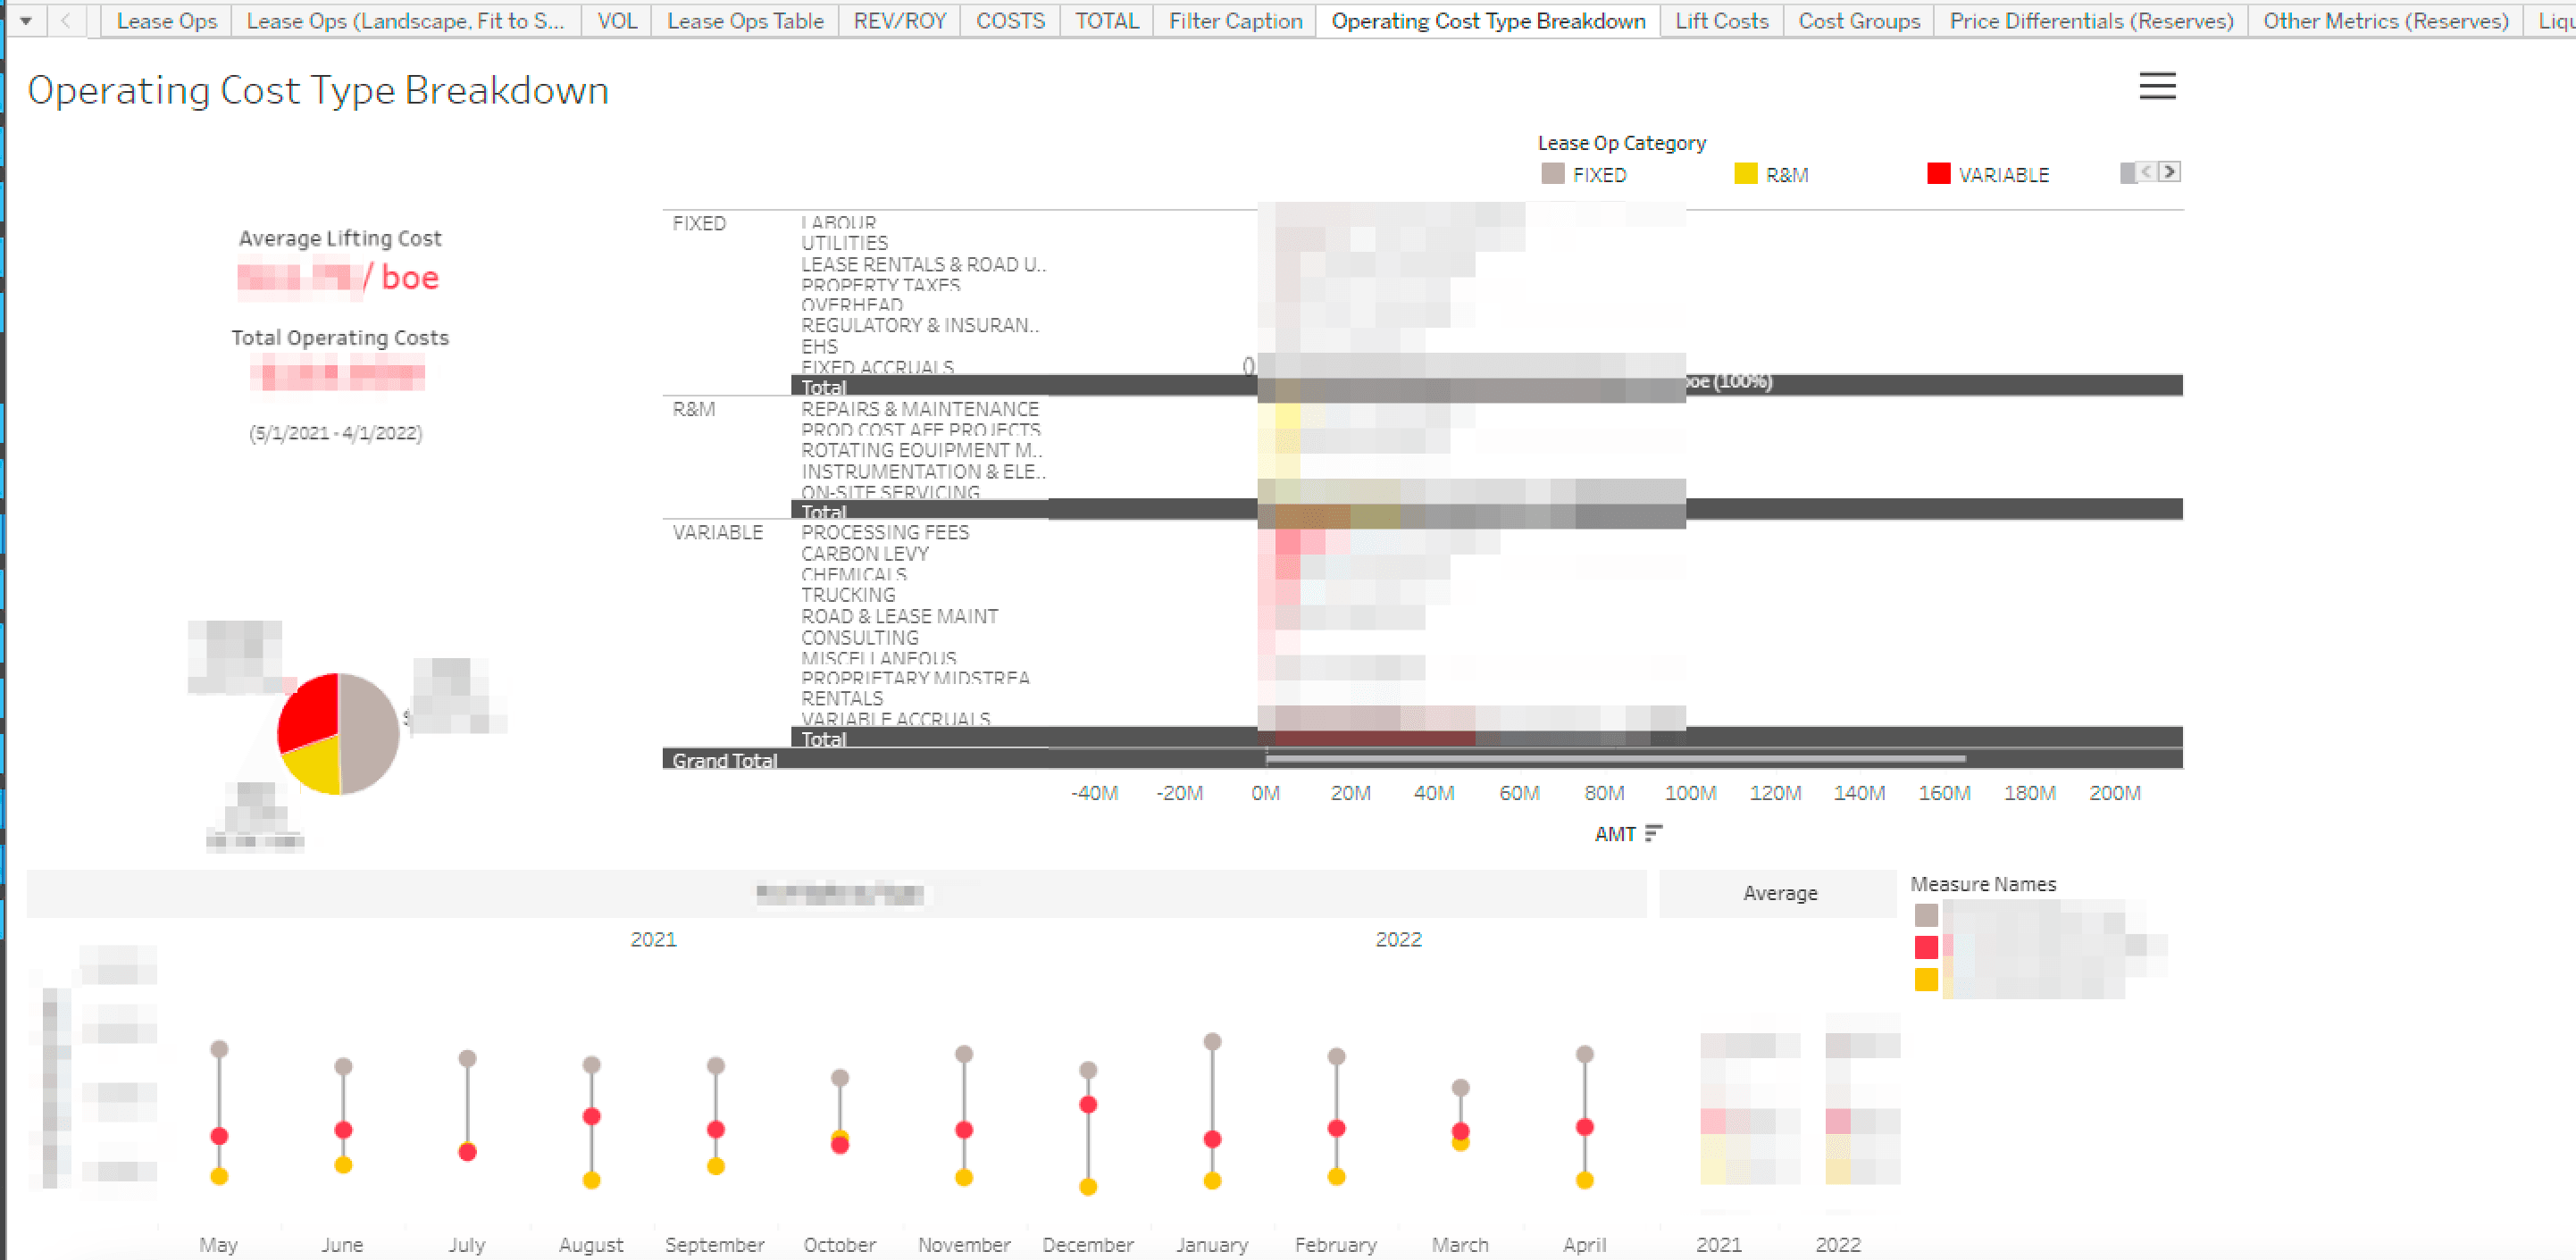
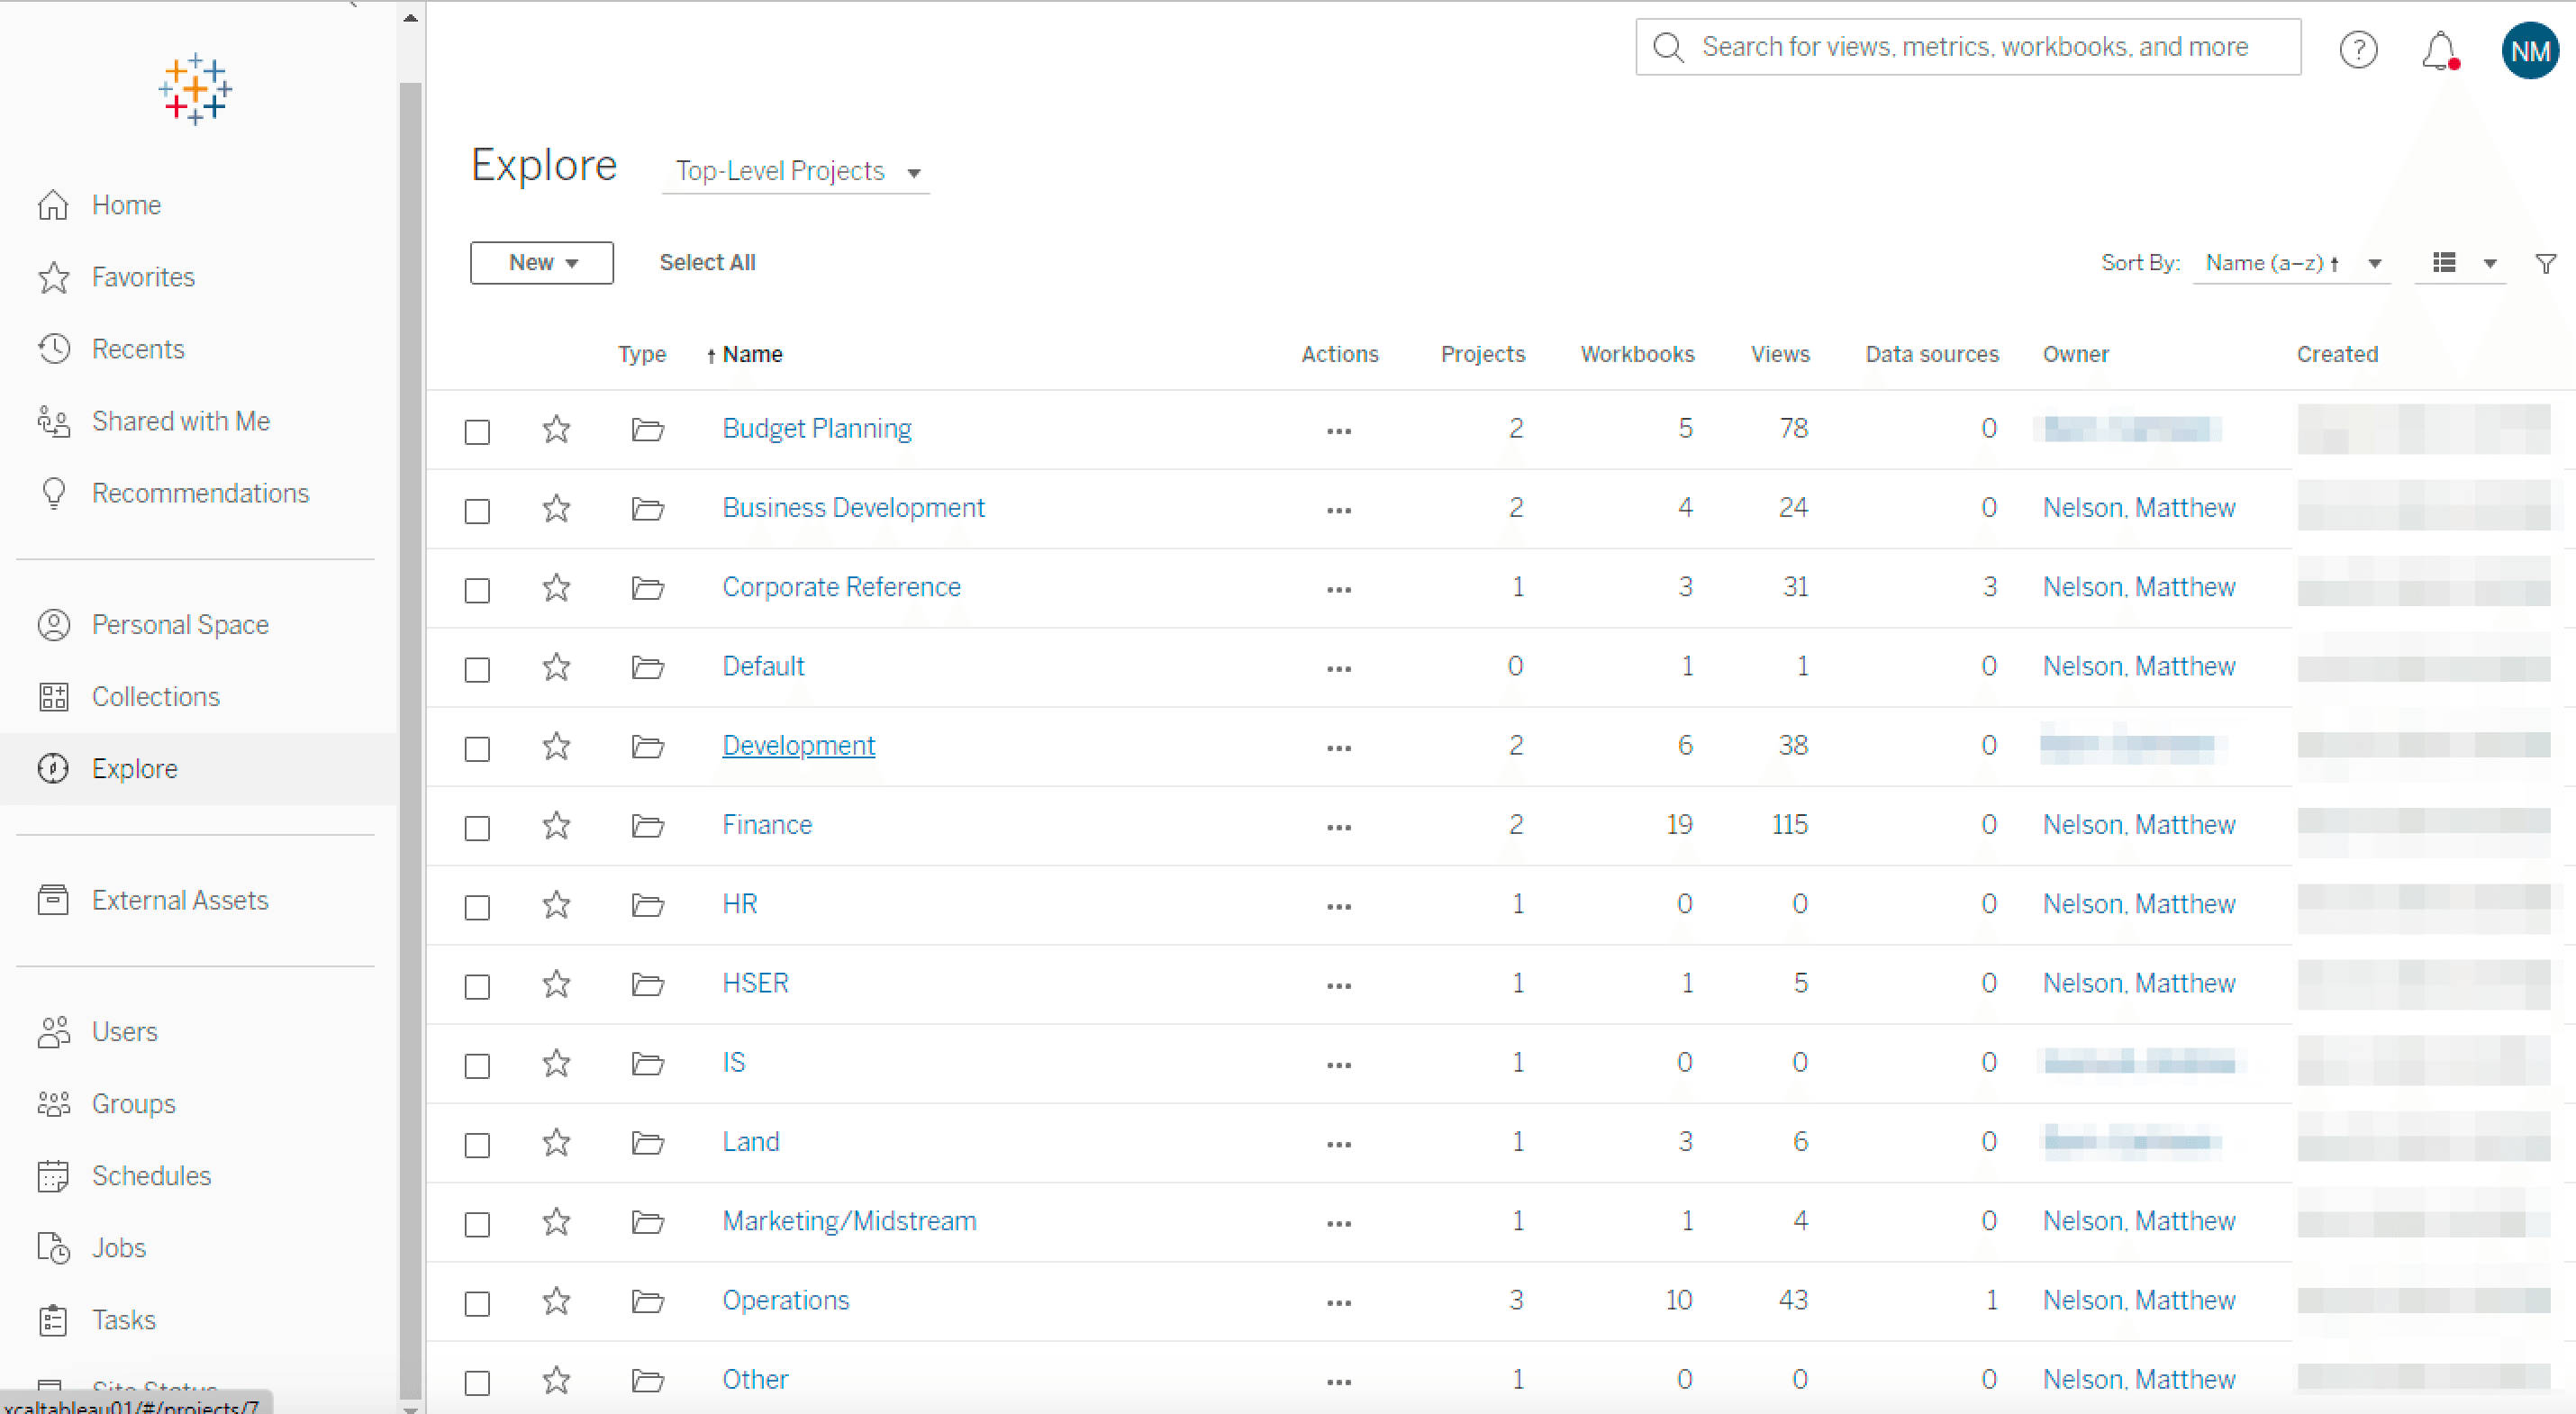
A few example corporate level dashboards (with details omitted, sorry about that - it doesn't really do them justice)
Challenges
The main challenges surrounding this project centered on three primary areas:
- The lack of a standardized data structure across the company. The company had a number of different databases, and each database had a different structure. This made it difficult to create a single source of truth for all data, and to create a single data warehouse that could be used by all employees. As the primary driver of the initiative, most of this challenge fell on my shoulders.
- The lack of understanding of how data must be cleaned and transformed before it can be visualized, and the technical knowledge required to do so. Very few individuals within the company had ever heard of SQL, and even fewer had any experience with it - making the process of explaining challenges with data and how to fix them very difficult. This also put a great deal of pressure on me to create a standardized data structure, and to create a data warehouse that could be used by all employees.
- The lack of a top-down mandate for business experts to create, own, and maintain their own data visualizations. Given that Tableau is designed to be a collaborative tool, well suited for self-service analytics, it was important that business experts be given the mandate to create their own data visualizations. This unfortunately was not explicitely stated by management, and as a result, many business experts were not given the mandate to create their own data visualizations. This ultimately led to a situation where I was responsible for creating and maintaining most key data visualizations and datasets, which was not sustainable in the long term.
Tableau Stats
Currently, after 4 years of use, the Tableau Server holds 450+ datasets, 4000+ workbooks, 155 total users (6 Creators, 12 Explorers, 137 Viewers), and 15,000+ views per month.